

What is Analytics?
Analytics is the reporting hub for your account. It replaces the older Reporting page with six tabs that share one set of filters, so you can move from “how fast are we recruiting?” to “who’s reading our research?” without rebuilding your view each time.Analytics is available to Admins only. Creators and Observers don’t see Analytics in the sidebar and can’t open its reports. If a teammate needs these numbers, an Admin can export a CSV and share it, or change their role.
Analytics is included on Enterprise plans. Accounts on other plans keep the older Reporting page under Resources in the sidebar. If you’re an Admin and see Reporting instead of Analytics, your account isn’t on an Enterprise plan.Admins on Enterprise plans can also run these reports from an AI tool through the Great Question MCP.
Opening Analytics
Admins open Analytics from Analytics in the left sidebar (marked New). It opens on the Overview tab, and each tab has its own address (for example,/reporting/research), so you can bookmark a tab directly.
The six tabs
Analytics is organized into six tabs, each answering a different question about the same underlying activity. Each tab label shows how many reports it contains.Why it matters
One filter bar for everything. Set a date range and a set of filters once, and they carry across every tab you visit. Panel and recruitment side by side. Recruitment speed, panel health, and invitation performance live on the same board instead of separate reports. Usage you can act on. See which teams are publishing studies, which research gets read, and how seats are being used, without stitching together multiple exports. Everything is exportable. Every chart and table can be exported to CSV, and the Reports tab turns the underlying data into files you can pull into your own tools.Filtering the board
Date range and grouping
Every tab shares the same Date range. The default runs from the first of the month six months ago through today, grouped by month, so every bar is a whole month. On the Research tab you can switch Group by to Week. Panel and Consumption charts are always grouped by month, and Overview, People, and Reports don’t chart over time, so Group by doesn’t appear there.Team, Person, Role, Method, and Status
Five more filters, Team, Person, Role, Method, and Status, sit in the same filter bar. Each tab only shows the filters its own reports use:
Team filters by the team that owns the study (studies with no team are grouped as Workspace). Person and Role filter by the person who created the study. Role options are Admin, Creator, and Observer. Method options are Interview, Survey, Online task, Unmoderated test, and Panel.
Status defaults to Live studies: Pending, Active, Paused, Closed, and Archived. Deleted studies and bookings are left out unless you select Deleted yourself.
Filters follow you from tab to tab. If you set a filter on one tab and switch to a tab that doesn’t show it, the filter stays active: you’ll still see its chip, and any report on that tab that supports the filter still applies it. For example, a Method filter set on Research also narrows the Invitation funnel on Panel. Clear the chip if you want the unfiltered number. When a filter is set but a card can’t use it, the card shows a Not filtered by… note so you know the number covers everything.
Overview
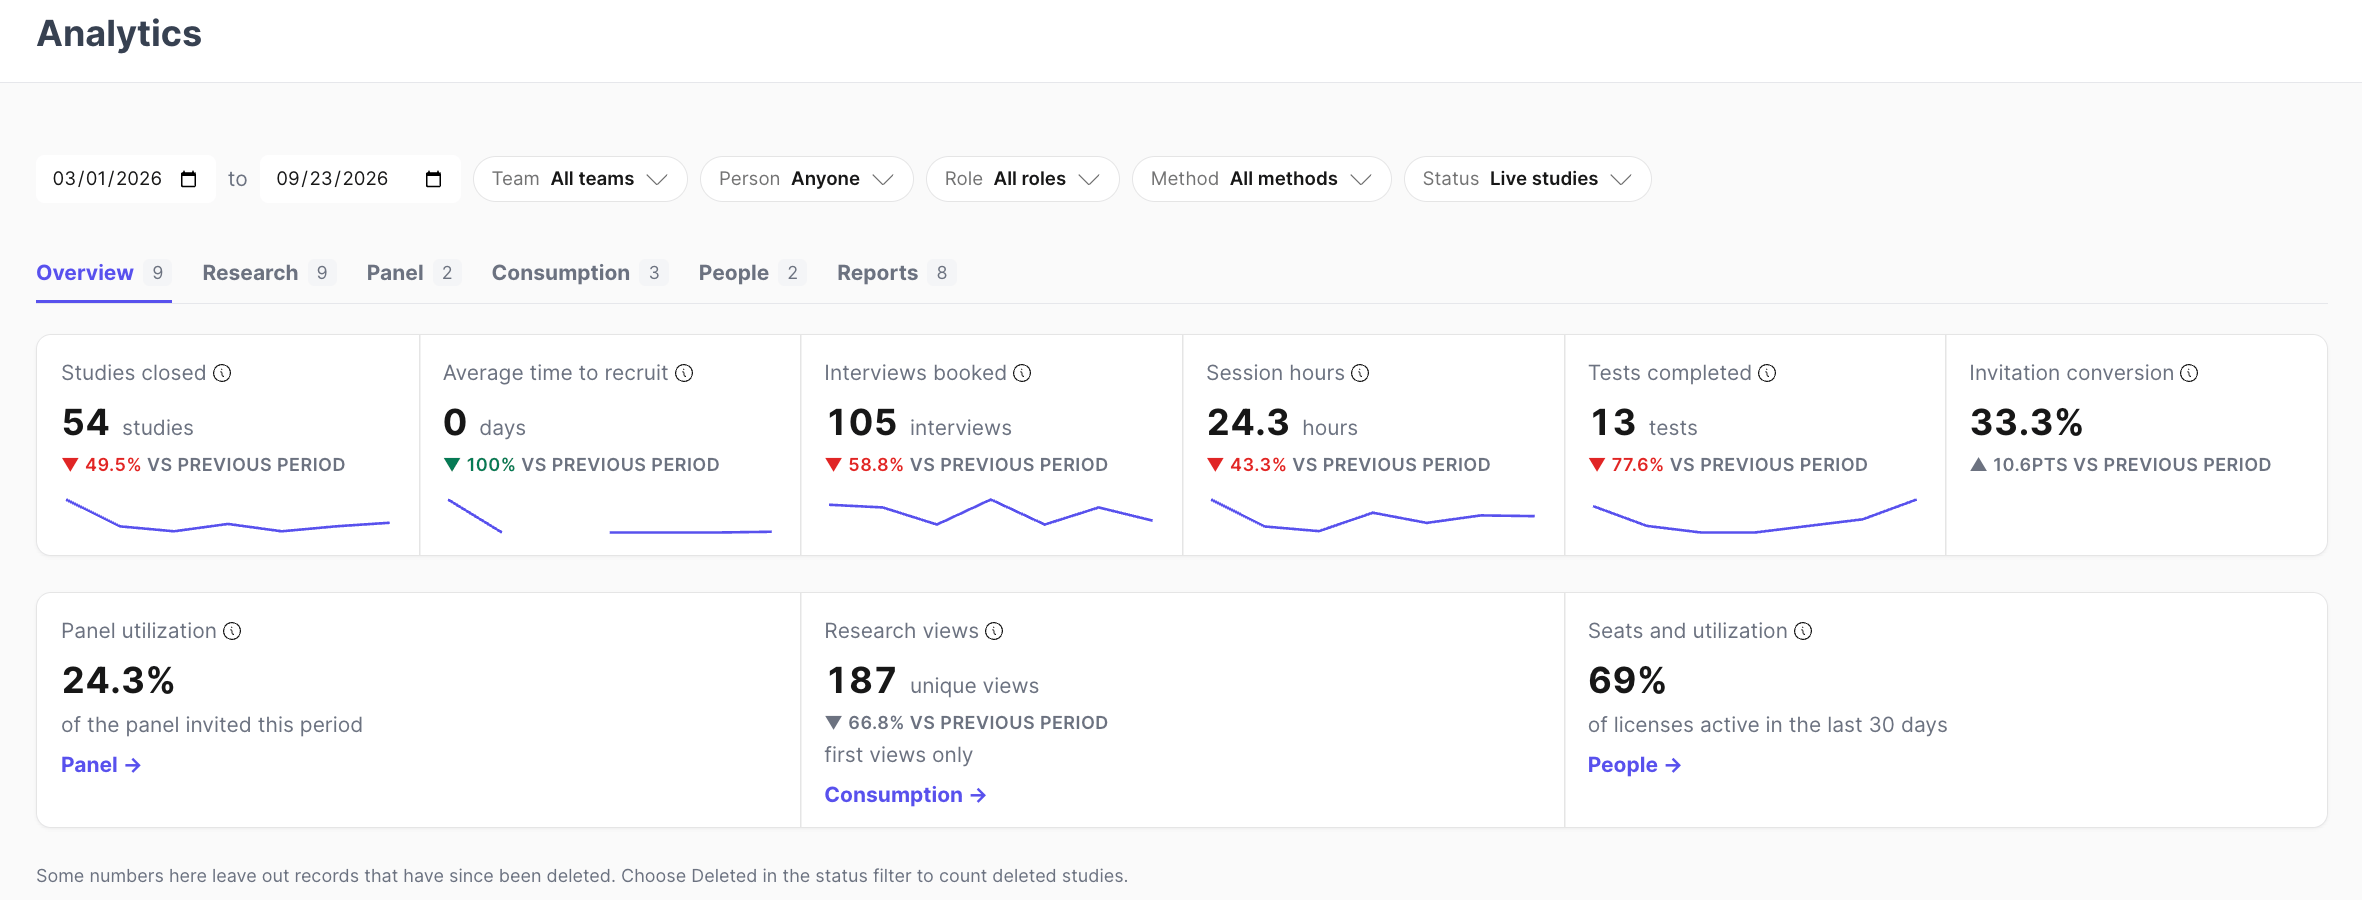
Your account’s headline numbers for the selected period, plus three tiles that link out to their own tabs. Each number card shows how it moved against the previous period of the same length (for example, ▲ 12% vs previous period).Research
Research breaks recruitment down over time and by team. Participant counts and timings here include participants recruited through an external panel. Usage covers Studies published, Interviews booked, Studies closed, and Participations completed over time, plus Studies published by team and Participations completed by team, which split those counts by the team that owns the study. A study with no team counts as Workspace. Recruitment duration covers Time to schedule first interview (days from going live to the first booking, averaged across studies that went live in the period), Average time to recruit, and Average time to schedule (days from going live to each individual booking, averaged across every booking).Panel
The Panel tab shows Panel health and the Invitation funnel. Panel numbers count your own panel only; participants recruited through an external panel are left out. The invitation funnel is the exception: it counts everyone invited, panel or not.How the panel numbers are counted
The panel reports are built from a snapshot Great Question takes of your panel every night. A few conventions apply across all of them:- The panel is every candidate in your account that hasn’t been deleted and didn’t come from an external provider. Externally recruited participants are never counted.
- Monthly values are closing snapshots. A month’s value is the last snapshot taken in that month, not a sum or an average of the days.
- Gaps stay gaps. A month with no snapshot shows as empty rather than zero, and no value carries forward across it.
- History starts at the first snapshot. Nightly snapshots began in September 2026, so monthly panel history before then is empty and can’t be recovered.
Panel health
The panel split by why someone can or can’t be approached, counted as it stands right now. Contactable is the one to read first: opted in and not excluded by any eligibility filter. Eligible counts only the health filters, Opted in counts only consent (see Opt-in, opt-out, and deletion), and the remaining buckets (Over-invited, Over-participated, Unresponsive, No-showed, Opted out, Unsubscribed) name the filter that excluded someone. A person can be in more than one bucket at once, over-invited and unresponsive, for example, so the buckets overlap and don’t add up to the panel. Read each one on its own, not as a share of the others. As bars, this report shows the panel today; as a table, it shows the same buckets month by month from the nightly snapshots.Panel utilization
Panel utilization appears as a card on the Overview tab. It’s the share of the panel invited to a study in each month: the candidates invited at least once that month, over the panel at the end of it. A few definitional details:- Counted from when the invitation was sent, or when the person asked to take part, not from when they were added to the study.
- Someone invited to three studies in a month counts once.
- Studies the product creates to carry a standalone incentive are left out, as are deleted studies and deleted participations.
Invitation funnel
The invitation funnel shows what became of the study invitations sent in the selected period, across four stages: invited, applied, booked, and completed. It’s a cohort funnel: every stage measures the same invitations, the ones sent in the range, and counts how many of them ever reached that stage, whenever that happened. An invitation sent in March that leads to a completed session in April still counts in March’s funnel. That’s why a stage can never exceed the one above it, even when a study straddles the end of the range. Invited counts a participation the moment it’s sent or requested. Applied, booked, and completed each count it once, however many times it was rebooked. Standalone-incentive studies are never counted, and deleted studies and participations are left out unless you include them.Consumption
Consumption tracks who’s reading your research: Insights, Sessions, Highlights, and Reels. Research views by role splits views into Guests (someone not signed in, viewing a publicly shared link), Admins, Creators, Observers, and Former members (people who’ve since left the account). Research views by type splits the same views by artifact type. Both count unique first-time views; opening the same piece again doesn’t count a second time. Most viewed research lists the top 50 artifacts by unique viewers. It has its own Type filter (Session, Highlight, Reel, Insight) if you want to see only one kind.People
People shows every member and outstanding invitation on your account, alongside seat utilization: the share of assigned seats active in the last 30 days. The stats across the top show Licenses assigned, Active last 30 days, Idle 60+ days, Never activated, and Studies created. The table lists each person’s name, teams, role, last activity, studies created, and status (Active, Idle for a number of days, or Never). Seat utilization counts paid seats only, which means Admins and Creators. Observers appear in the table but don’t count toward utilization. To see whether Observers are signing in, check their Last activity or export the CSV. The CSV export adds email, invitation date and inviter, join date, last login, seat type (Paid or Free), seat status, and which integrations (Google, Microsoft, Zoom, Webex, Slack, Qualtrics) each person has connected.Reports
Reports turns your account’s data into exportable CSVs rather than charts. Use these when you need the underlying rows for your own analysis.
Custom attributes and Screener questions describe your whole account as it stands today, so the date range doesn’t change them.
Exporting data
Every chart and table on the board can be exported:- Chart cards have Export CSV and Download PNG. The PNG downloads immediately.
- Table cards and each row on the Reports tab have Download CSV.
Tables on the board show up to 500 rows (“Showing 500 of 1,240 rows”). The CSV export always includes every row.
If a number looks different from the Reporting page
A few numbers moved when Analytics replaced the Reporting page. None of it is missing data, it’s more consistent counting. Deleted studies and bookings are left out by default. The Reporting page counted everything an account ever had, including anything later deleted. Analytics leaves deleted studies and bookings out unless you select Deleted in the Status filter. When records were left out, a note at the bottom of the board says so. Standalone incentives aren’t counted as studies. Paying an incentive outside of any study creates a hidden placeholder to carry the payment. The Reporting page counted those placeholders as published and closed studies; Analytics doesn’t. A rescheduled interview stays in the month it was first booked. The Reporting page moved a rebooked interview to the month it was rebooked. Analytics keeps it in the month it was originally scheduled, so a few interviews may land in a different month than you remember. Recruitment timing is measured from every booking. Average time to recruit and Time to schedule first interview are calculated from each booking directly. Trust the Analytics figures over the Reporting page’s.Troubleshooting
Still need help? Contact us at support@greatquestion.co — median response time is 19 minutes during support hours.